From SCADA UX to User Interface and Development
We will examine the most effective tools we can use when transitioning from user experience design to user interface and implementation in SCADA and IIoT applications.
As a developer in the SCADA field, I think writing something under this heading will offer an innovative perspective both for myself and for application developers in the SCADA field like me. Additionally, this article will increase the interest of many software developers and designers who work on UX and UI design and development in the field of SCADA applications.
So what am I trying to convey?
What I am actually trying to reach here are two distinct audiences that develop applications and design in the same disciplines. The first of these are those who already know UX and UI concepts well, are proficient in modern application development techniques, and develop web applications using the necessary modern tools. The other audience is SCADA application developers, which I am also part of. For the first audience to fully focus on this article and understand the subject, I suggest that while reading this article they open a new tab in their browser, type 'scada mimic ISA-101' into Google Images search, and take a look at the results.
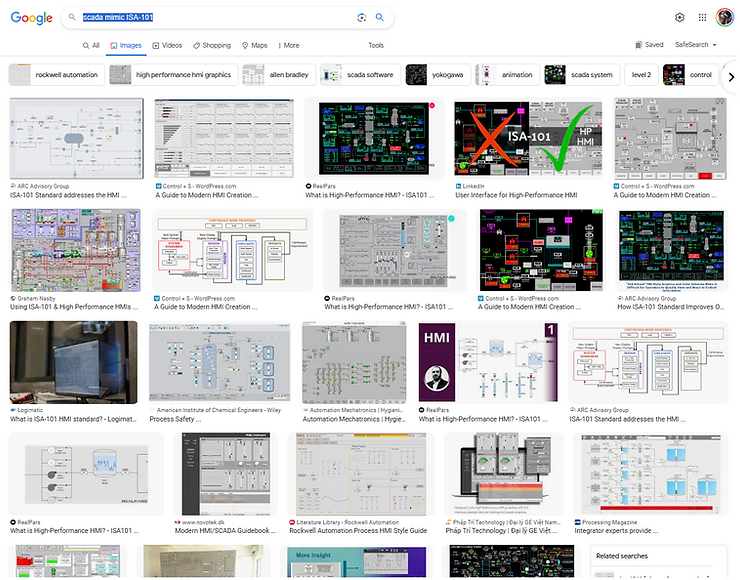
Results obtained when typing "scada mimic ISA-101" into Google Images search engine
The results, images and screenshots you see are all user interfaces of SCADA applications. These interfaces you see are called 'Mimic Screens' in the SCADA field. Many of these designs are user interfaces made with different SCADA software. Although these interfaces in SCADA software are designed with interpretations of new design standards (ISA-101), similar results emerge. I can almost hear the inner voice of the first audience seeing these results: 'These cannot be considered design!'
You are right, first audience. Try to understand why. You don't know the constraints and challenges we face, nor the tools we have to use while doing this work. And this is exactly where we have a solution to offer.
From Figma to inSCADA
Together with our partner Des Elektroteknik, who develops automation solutions in the marine sector and has signed off on many domestic and international projects, we are developing a SCADA application on the inSCADA Platform related to a ship's 'HVAC and Water System'. Initially, while continuing to develop the application with familiar methods and approaches — that is, while heading toward results similar to the outputs above — we realized that the project owner (Teknotherm Marine) had an innovative vision for the application, was working with a professional design team on this matter, and wanted to proceed with certain standards. When we looked at the designs they shared with us, we saw that they contained very fine details and that they had put a lot of effort into UX. The designs they had made in Figma were waiting to be turned into a real application. See Figure 2 for a UI of a Water System designed in Figma.
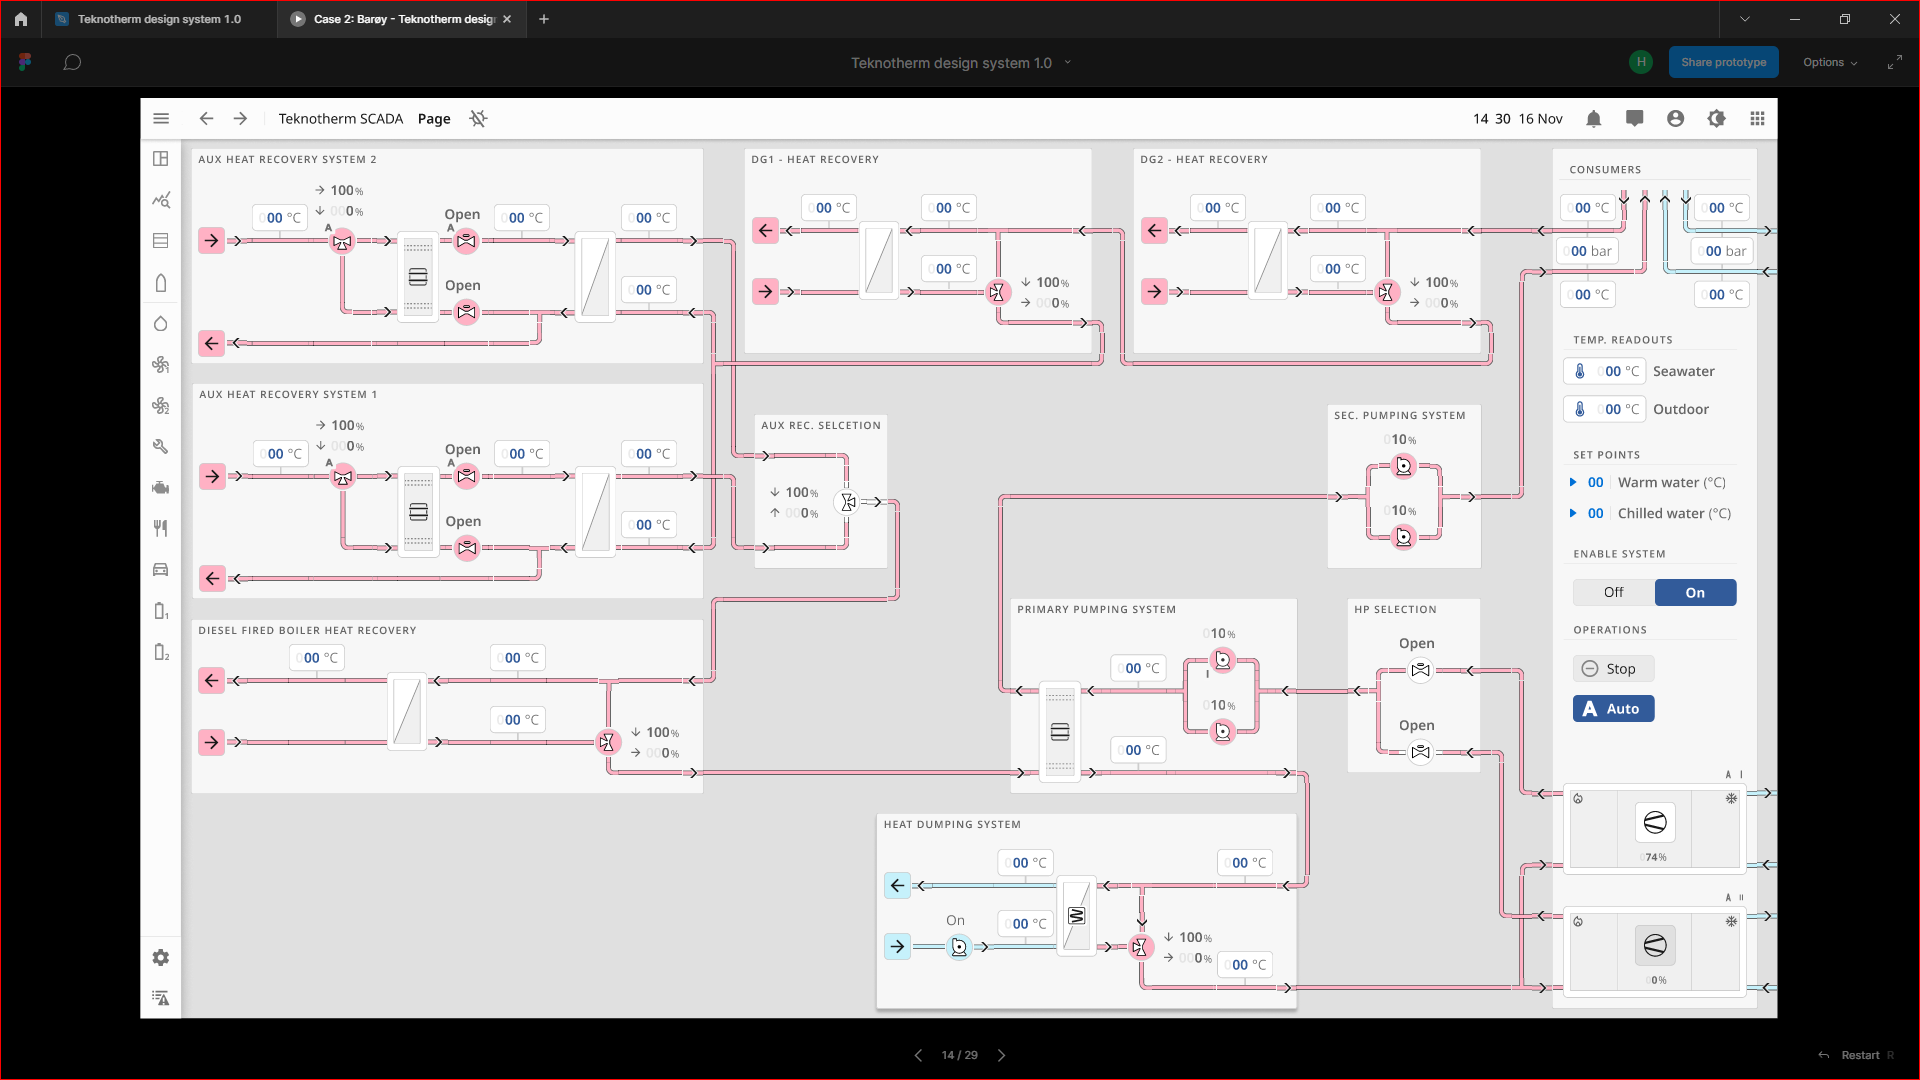
Figure 2: Figma Preview for SCADA Application UI and Water System Mimic — Thermal Energy Management System (TEMS) by Teknotherm Marine AS. For more information contact sigbjorn.tyssen@teknotherm.no or jan.nordvik@teknotherm.no. The design is based on the OpenBridge Design System 5.0
"Teknotherm (part of the Heinen & Hopman group) is one of the leading companies when it comes to Marine and Offshore systems. With a focus on energy consumption on board ships, together with their partner Ulmatec Thermal Solution, they have developed a complete thermal management system for vessels. These systems are complex and require a high degree of automation. A good Scada system is essential to understand, monitor, and optimize the operation of the system. With the goal of creating a Scada system that feels familiar and intuitive to operators, Teknotherm based its designs on the OpenBridge Design system. The OpenBridge Design System is an open design system adapted to the maritime context and regulations, built on modern principles of user interface and workplace design."
The Teknotherm team designs many user interfaces, similar to the one shown in Figure 2, with the OpenBridge Design System 5.0 guide, tailored to their HVAC and Water Systems. At first glance, turning all these designs into applications — especially ones that require real-time visualization as in SCADA applications — might appear to be a quite time-consuming task. However, there is a simple way to do this on the inSCADA platform. Let's first see the result in Figure 3.
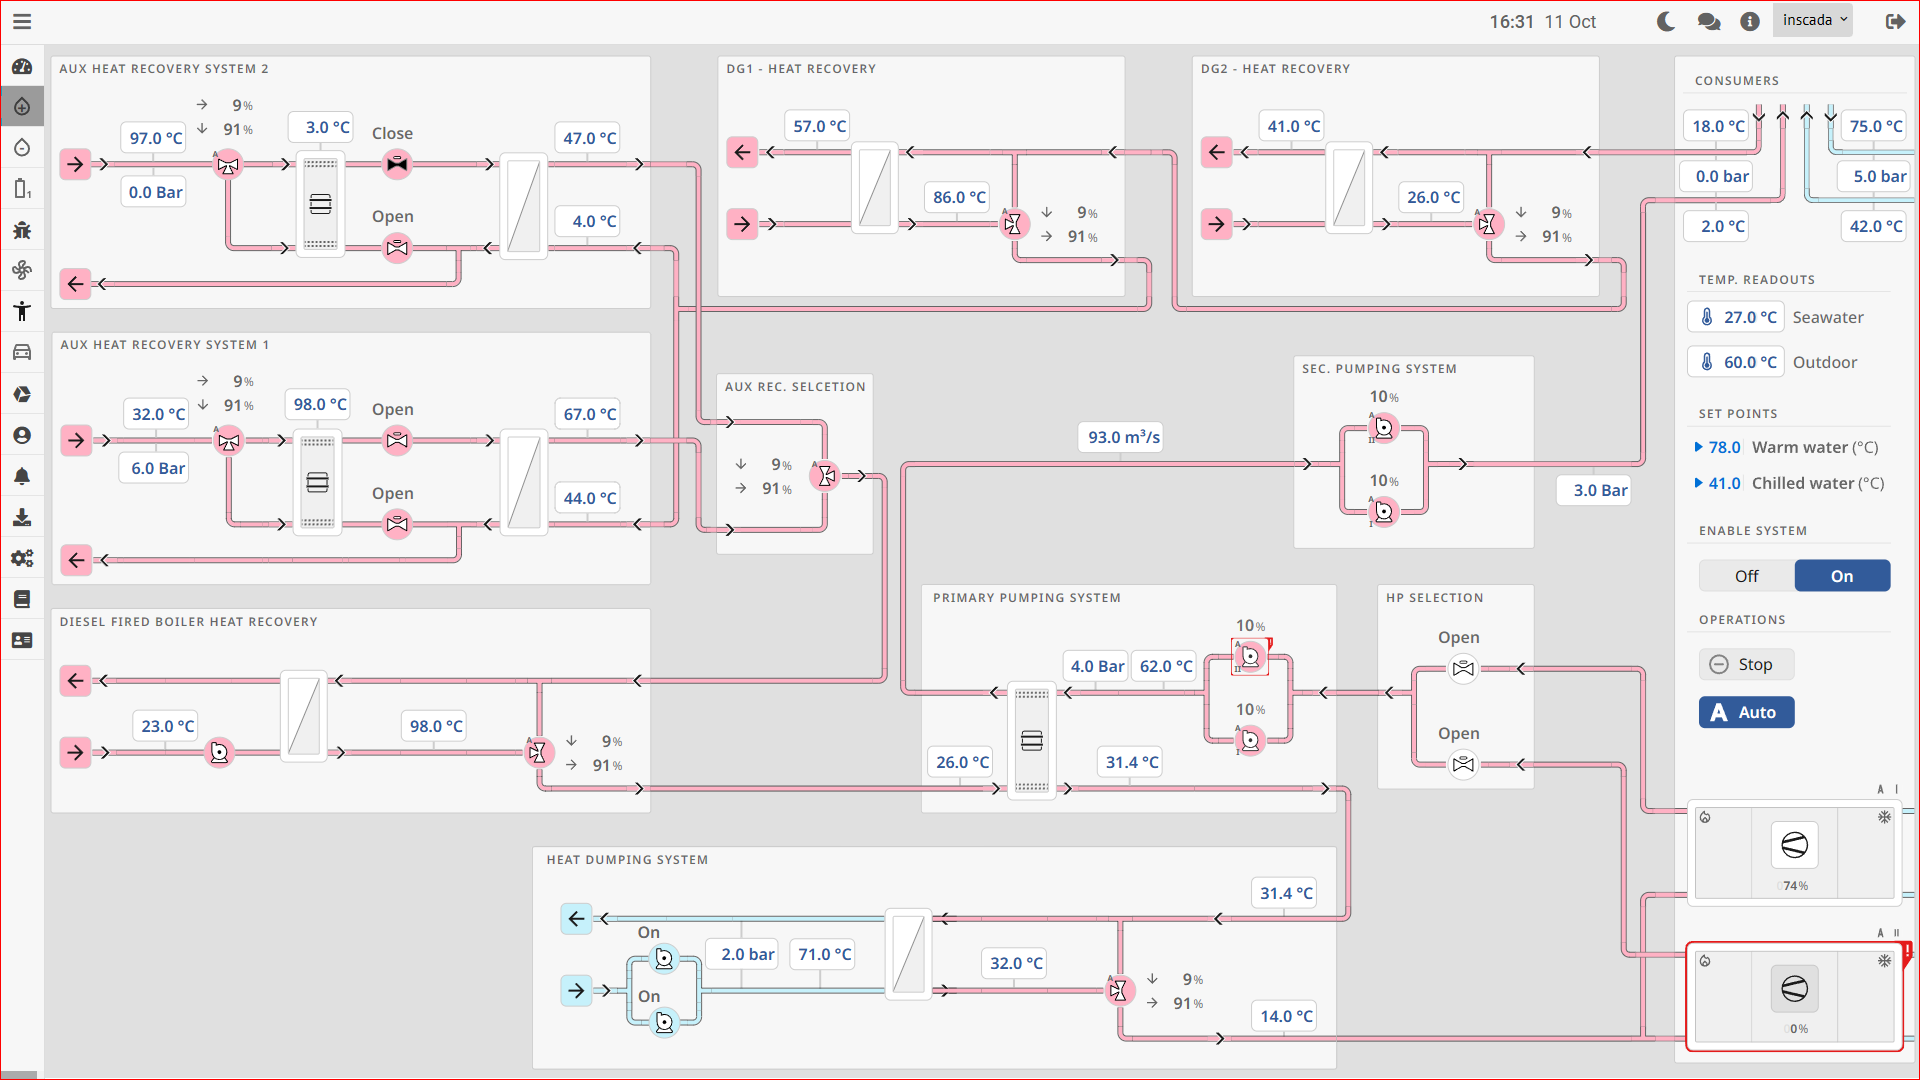
Figure 3: Water System Mimic at inSCADA Runtime — Thermal Energy Management System (TEMS) by Teknotherm Marine AS. The design is based on the OpenBridge Design System 5.0
As shown in Figure 3, a UI designed in Figma can be transferred to the inSCADA platform quickly and without loss, without the need for front-end development work (CSS, JavaScript), and put to immediate use.
SVG-Based Visualization
The key feature that allows a UI designed in Figma to quickly become an application is inSCADA's ability to perform SVG-based visualization. We can export in SVG format with appropriate settings from Figma and instantly transfer it to the inSCADA platform. The other question that comes to mind is: how are the visualizations or animations actually done? Here, inSCADA's animation application technique comes to the fore again.
"In the inSCADA platform, you can bind any animation type (get, color, rotate, move, etc.) and data to any object (text, rectangle, path, etc.) in mimic screens (SVG)."
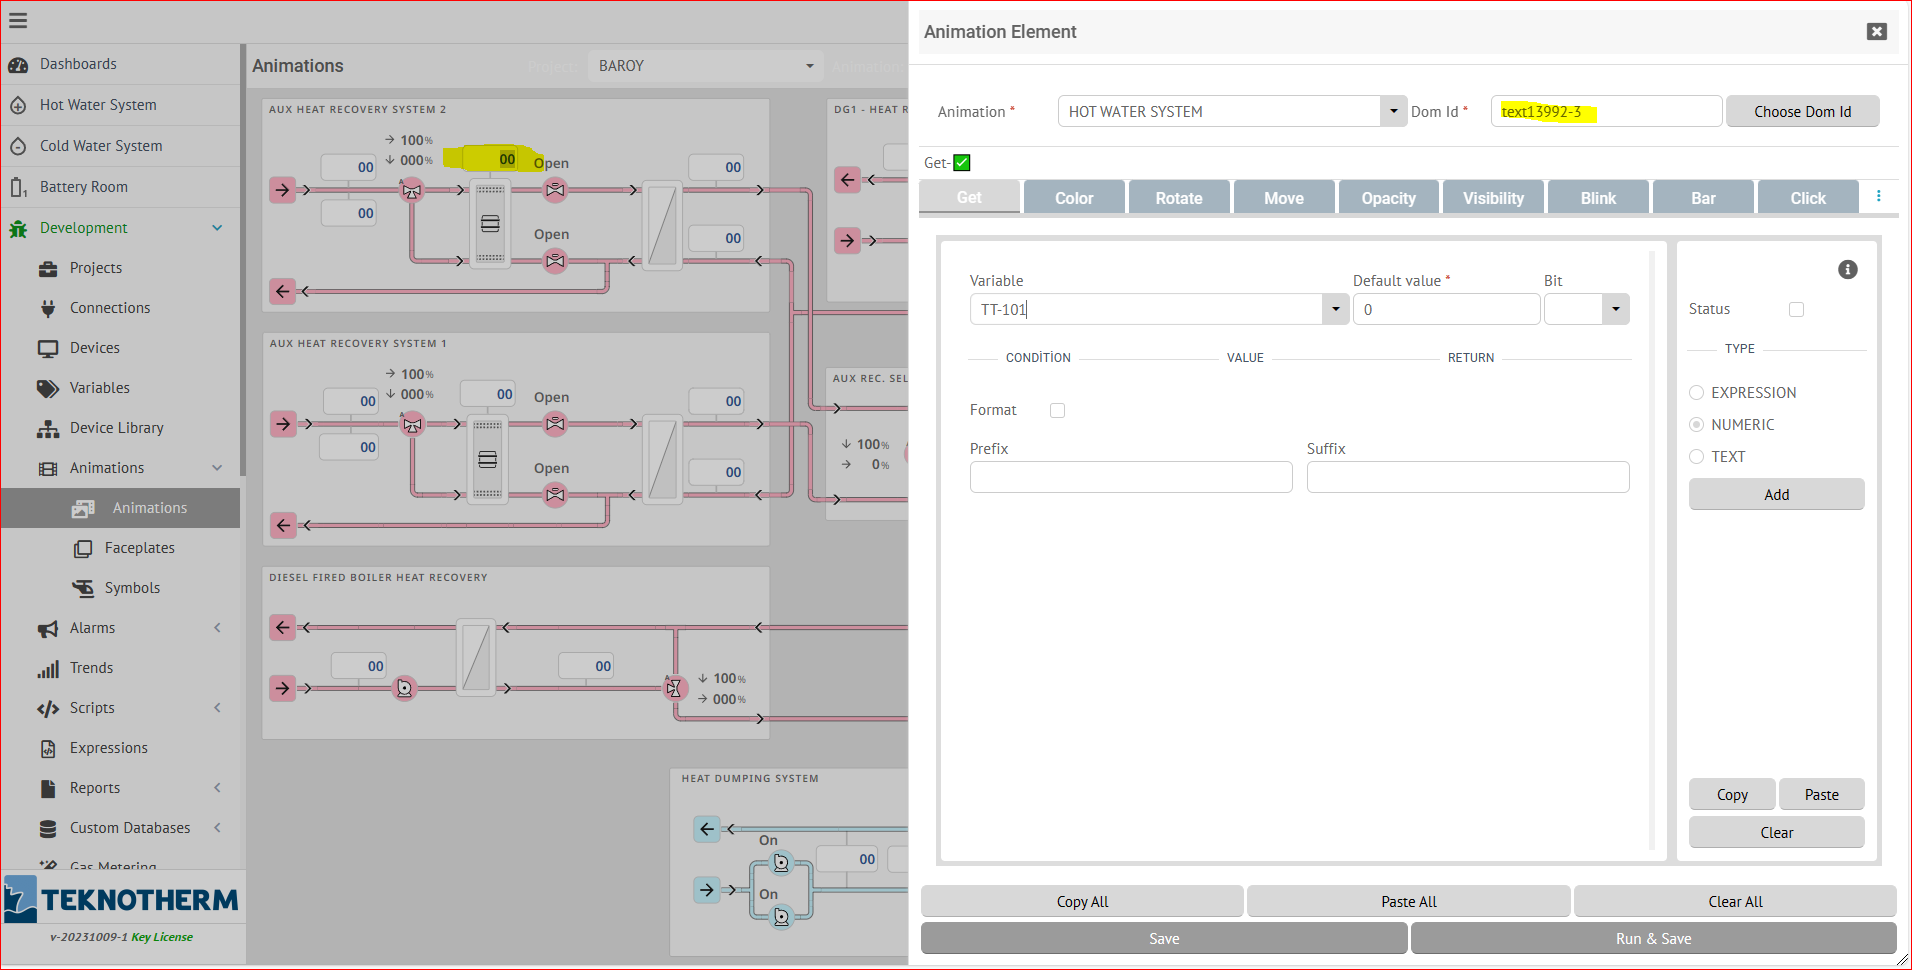
Figure 4: Binding 'GET' animation to the selected text object on the inSCADA Platform
The technique of binding animations and data to objects over SVG, which the inSCADA platform uses for visualization, actually saves developers from entering into many programming and development details. It allows focusing solely on requirements and customer needs. On top of this, the designs produced by your design team can be used almost without loss. Revision requests between design and implementation teams, the meetings tied to those revision requests, and the time spent on the project as a consequence — all are reduced. In summary, productivity increases.
In the near future, I believe that, just like presentations, web applications, brand, and slogan designs found in design communities (figma.com/community etc.), user interfaces for SCADA applications and digital twin designs of SCADA system instruments will also be available.
I plan to share the experience we described in this article — once the project is complete — as a successful application story with all its details. Thanks to the project stakeholders for choosing the inSCADA platform and collaborating with us.